Video content contains a wealth of information that, when properly structured, can power advanced search, analytics, and insights. In this guide, we’ll walk through extracting structured data from cooking videos using Cloudglue’s entity extraction capabilities.By the end, you’ll learn how to:
Create an entity collection for cooking videos
Define a structured schema for recipe information
Extract detailed data from YouTube cooking videos
Analyze and visualize patterns across multiple videos
First, we’ll create a collection specifically for cooking videos with a schema that captures recipe details, equipment, actions, ingredients, and cooking phases.
Copy
Ask AI
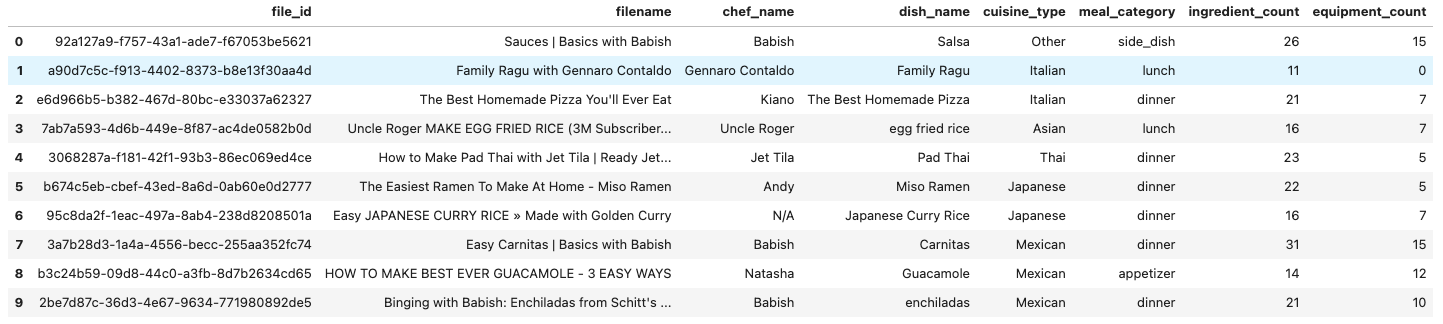
# Define our extraction schema - simplified to include only what we need for analysisschema = { "recipe": { "chef_name": "string", "dish_name": "string", "cuisine_type": "Italian|Mexican|Asian|French|American|Mediterranean|Indian|Thai|Chinese|Japanese|Other", "meal_category": "breakfast|lunch|dinner|snack|dessert|appetizer|side_dish" }, "equipment_mentioned": ["string"], "cooking_actions": ["string"], "ingredients": ["string"], 
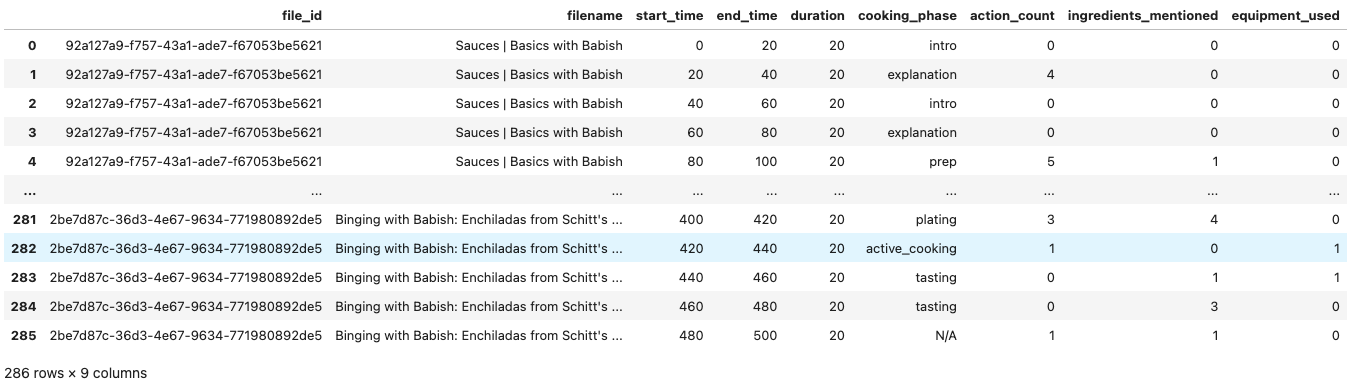
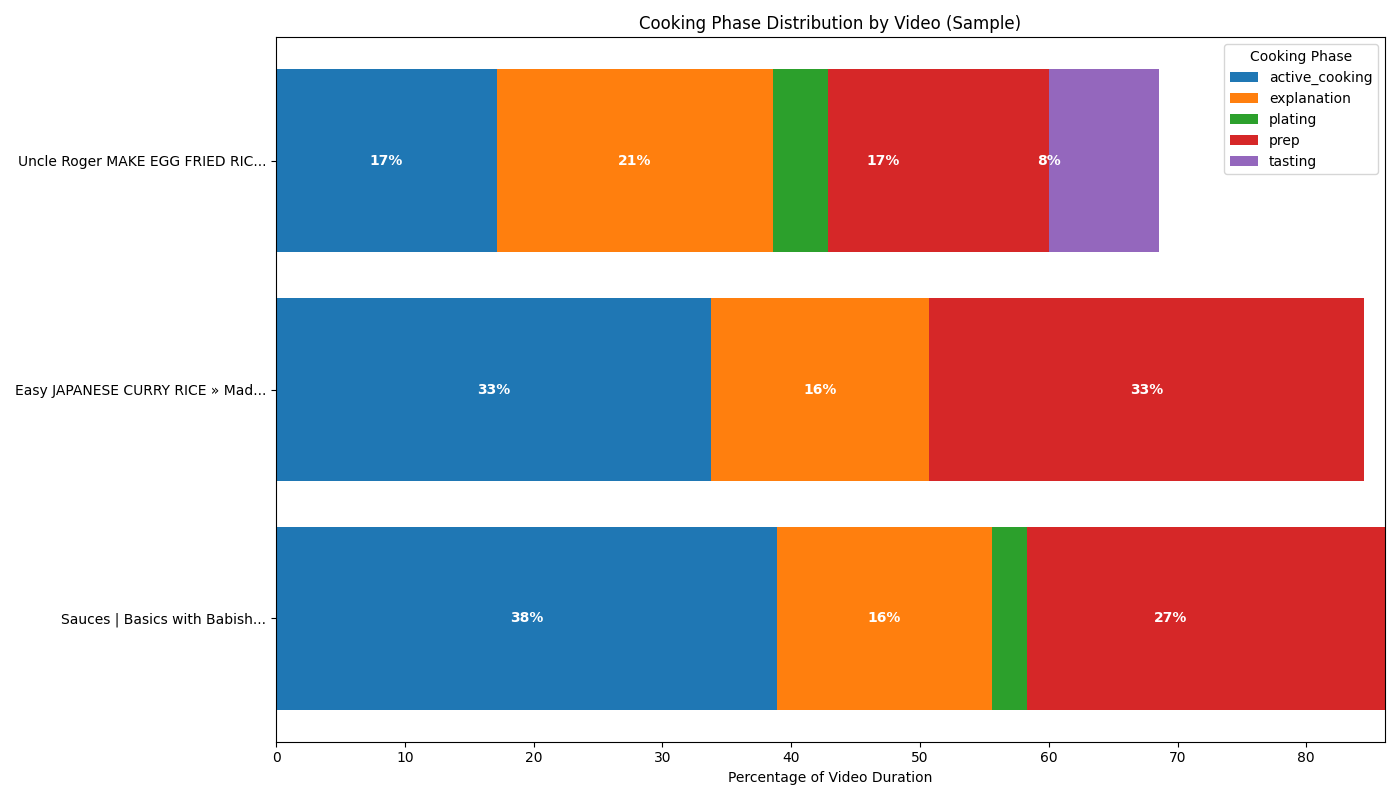
"cooking_phase": "prep|active_cooking|plating|tasting|explanation|cleanup|intro|outro"}# Define our extraction prompt - with precise field mappingsprompt = """Extract cooking information from this recipe video transcript using these exact field names:1. RECIPE (populate "recipe" object): - chef_name: Identify the chef's name - dish_name: Name of the dish being prepared - cuisine_type: Choose one from: Italian, Mexican, Asian, French, American, Mediterranean, Indian, Thai, Chinese, Japanese, Other - meal_category: Choose one from: breakfast, lunch, dinner, snack, dessert, appetizer, side_dish2. EQUIPMENT_MENTIONED (populate "equipment_mentioned" array)3. COOKING_ACTIONS (populate "cooking_actions" array): - Example specific cooking action (e.g., chopping, stirring, mixing, baking, frying, etc.)4. INGREDIENTS (populate "ingredients" array)5. COOKING_PHASE (populate "cooking_phase" field): - Classify the current segment as one of: prep, active_cooking, plating, tasting, explanation, cleanup, intro, outroFocus on extracting information exactly as spoken in the transcript."""# Create a collection for recipe videoscollection = client.collections.create( name="Cooking Videos Analysis", collection_type="entities", description="Collection of cooking videos for recipe analysis", extract_config={ "schema": schema, "prompt": prompt })
Now, let’s add 10 different cooking videos to our collection. We’ll choose a variety of cuisines and meal types.
Copy
Ask AI
# List of YouTube video URLs for different cuisinesyoutube_urls = [ # Replace with urls to youtube videos with different recipe types (or cloudglue:// uploads) "https://www.youtube.com/watch?v=VIDEO_ID1", "https://www.youtube.com/watch?v=VIDEO_ID2", # etc ...]# Add each video to the collectionfile_ids = []for url in youtube_urls: try: # Add YouTube video to collection result = client.collections.add_youtube_video(collection.id, url=url) file_ids.append(result.file_id) print(f"Added video: {url} with file ID: {result.file_id}") except Exception as e: print(f"Error adding {url}: {str(e)}")
The extraction process runs asynchronously. Let’s monitor and wait for the extraction to complete.
Copy
Ask AI
import time# Function to check if all videos are processeddef all_videos_processed(collection_id, file_ids): processed_count = 0 for file_id in file_ids: try: file_info = client.collections.get_video(collection_id, file_id) if file_info.status == "completed": # Verifying entities record exists and is ready for video, otherwise 404 entities = client.collections.get_video_entities(collection_id, file_id) processed_count += 1 except Exception as e: print(f"Error checking status for file {file_id}: {str(e)}") return processed_count, len(file_ids)# Check status every 15 secondswhile True: processed, total = all_videos_processed(collection.id, file_ids) print(f"Processed {processed} of {total} videos") if processed == total: print("All videos processed!") break print("Waiting 15 seconds before checking again...") time.sleep(15)
Let’s compare the average number of ingredients used in each cuisine type.
Copy
Ask AI
# Group by cuisine_type and calculate average ingredient countcuisine_ingredients = videos_df.groupby('cuisine_type').agg({ 'ingredient_count': 'mean', 'file_id': 'count'}).reset_index()# Rename columns for claritycuisine_ingredients.columns = ['Cuisine Type', 'Avg Ingredients', 'Videos']# Print tableprint("Ingredient Count by Cuisine Type:")print(cuisine_ingredients.to_string(index=False, formatters={ 'Avg Ingredients': '{:.1f}'.format}))# Create a bar chartplt.figure(figsize=(10, 6))plt.bar(cuisine_ingredients['Cuisine Type'], cuisine_ingredients['Avg Ingredients'], color='skyblue')plt.title('Average Number of Ingredients by Cuisine Type')plt.xlabel('Cuisine Type')plt.ylabel('Average Ingredient Count')plt.xticks(rotation=45)# Add video count as text above each bar - using reliable column accessfor i, (_, row) in enumerate(cuisine_ingredients.iterrows()): plt.text(i, row['Avg Ingredients'] + 0.3, f"{row['Videos']} videos", ha='center')plt.tight_layout()plt.savefig('ingredient_comparison.png')plt.show()# Print insightif len(cuisine_ingredients) >= 2: max_cuisine = cuisine_ingredients.loc[cuisine_ingredients['Avg Ingredients'].idxmax()] min_cuisine = cuisine_ingredients.loc[cuisine_ingredients['Avg Ingredients'].idxmin()] percentage_diff = ((max_cuisine['Avg Ingredients'] - min_cuisine['Avg Ingredients']) / min_cuisine['Avg Ingredients']) * 100 print(f"\nINSIGHT: {max_cuisine['Cuisine Type']} recipes in our sample need {percentage_diff:.0f}% more ingredients " f"than {min_cuisine['Cuisine Type']} ones")
Copy
Ask AI
Ingredient Count by Cuisine Type:Cuisine Type Avg Ingredients Videos Asian 16.0 1 Italian 16.0 2 Japanese 19.0 2 Mexican 22.0 3 Other 26.0 1 Thai 23.0 1INSIGHT: Other recipes in our sample need 62% more ingredients than Asian ones
Let’s analyze how much time each video spends in different cooking phases.
Copy
Ask AI
# 1. Calculate duration by phase for each videophase_duration = segments_df.groupby(['file_id', 'filename', 'cooking_phase'])['duration'].sum().reset_index()# 2. Calculate total duration for each videovideo_total_duration = segments_df.groupby(['file_id', 'filename'])['duration'].sum().reset_index()# 3. Merge and calculate percentagesphase_percentage = pd.merge(phase_duration, video_total_duration, on=['file_id', 'filename'])phase_percentage['percentage'] = (phase_percentage['duration_x'] / phase_percentage['duration_y']) * 100# 4. Create pivot tablephase_pivot = phase_percentage.pivot_table( index=['file_id', 'filename'], columns='cooking_phase', values='percentage', fill_value=0).reset_index()# 5. Prepare for visualizationmain_phases = ['prep', 'active_cooking', 'plating', 'tasting', 'explanation']available_phases = [col for col in phase_pivot.columns if col in main_phases]# Create a stacked bar chartplt.figure(figsize=(14, 8))# Sample 3 videos for clearer visualizationif len(phase_pivot) > 3: sample_videos = phase_pivot.sample(n=3)else: sample_videos = phase_pivot# Create shorter names for displaysample_videos['short_name'] = sample_videos['filename'].str.slice(0, 30) + '...'# Plot stacked barsbottom = np.zeros(len(sample_videos))for phase in available_phases: plt.barh(sample_videos['short_name'], sample_videos[phase], left=bottom, label=phase) bottom += sample_videos[phase]# Add percentage text inside barsfor i, (_, row) in enumerate(sample_videos.iterrows()): x_pos = 0 for phase in available_phases: if row[phase] > 5: # Only show if > 5% width = row[phase] plt.text(x_pos + width/2, i, f"{int(width)}%", ha='center', va='center', color='white', fontweight='bold') x_pos += widthplt.title('Cooking Phase Distribution by Video (Sample)')plt.xlabel('Percentage of Video Duration')plt.legend(title='Cooking Phase')plt.tight_layout()plt.savefig('phase_duration.png')plt.show()
This visualization reveals how different cooking videos distribute their time across various cooking phases. We can observe that:
Active cooking takes up a significant portion (17-38%) of the videos
Videos vary considerably in how they balance explanation (16-21%) and prep (17-33%)
Some videos allocate a small portion (around 8%) to tasting phase
The distribution of phases can indicate the style and target audience of a cooking video:
Videos with more prep time may be better for beginners
Videos with more active cooking focus on the technical aspects
Videos with more explanation time provide more context and background
This type of analysis helps content creators understand the structure of successful cooking videos and allows viewers to find videos that match their preferred learning style.
Let’s select one representative video and chart how the complexity (measured by actions per segment) changes over time.
Copy
Ask AI
# Select one video for timeline analysis (pick the one with most actions)video_action_counts = segments_df.groupby('file_id')['action_count'].sum().reset_index()representative_file_id = video_action_counts.sort_values('action_count', ascending=False).iloc[0]['file_id']# Get the representative video's namerepresentative_name = videos_df[videos_df['file_id'] == representative_file_id]['filename'].iloc[0]# Filter segments for the selected videovideo_segments = segments_df[segments_df['file_id'] == representative_file_id].sort_values('start_time')# Create a timeline plot with larger figure size for better spacingplt.figure(figsize=(14, 8))plt.plot(video_segments['start_time']/60, video_segments['action_count'], 'o-', color='blue', label='Actions')plt.title(f'Action Complexity Timeline: {representative_name}')plt.xlabel('Time (minutes)')plt.ylabel('Number of Cooking Actions')plt.grid(True, linestyle='--', alpha=0.7)# Add cooking phase as background colorsphase_colors = { 'intro': 'lightgray', 'prep': 'lightyellow', 'active_cooking': 'lightcoral', 'plating': 'lightgreen', 'tasting': 'lightblue', 'explanation': 'lavender', 'outro': 'lightgray'}# Add colored backgrounds for phasesfor i in range(len(video_segments)-1): phase = video_segments.iloc[i]['cooking_phase'] start = video_segments.iloc[i]['start_time']/60 end = video_segments.iloc[i]['end_time']/60 if phase in phase_colors: plt.axvspan(start, end, alpha=0.3, color=phase_colors[phase])# Add annotations for peak complexity - position adjusted to avoid overlappeak_idx = video_segments['action_count'].idxmax()peak_time = video_segments.loc[peak_idx, 'start_time']/60peak_actions = video_segments.loc[peak_idx, 'action_count']peak_phase = video_segments.loc[peak_idx, 'cooking_phase']# Position the annotation to the left and below the peak to avoid title overlapplt.annotate(f'Peak: {peak_actions} actions\nPhase: {peak_phase}', xy=(peak_time, peak_actions), xytext=(peak_time-2.0, peak_actions-1), arrowprops=dict(arrowstyle='->'))# Add a legend for phases - position in the upper right to avoid overlapphase_patches = [plt.Rectangle((0,0),1,1, color=color, alpha=0.3) for color in phase_colors.values()]plt.legend(phase_patches, phase_colors.keys(), loc='upper right', title='Cooking Phases')# Add some padding to the top of the plot for the titleplt.ylim(top=plt.ylim()[1] * 1.1)plt.tight_layout()plt.savefig('action_complexity.png')plt.show()# Print insightpeak_minute = int(peak_time)print(f"\nINSIGHT: For '{representative_name}', peak complexity happens at minute {peak_minute} during {peak_phase} phase")print(f"INSIGHT: The busiest segment has {peak_actions} distinct cooking actions")
Copy
Ask AI
INSIGHT: For 'Sauces | Basics with Babish', peak complexity happens at minute 3 during prep phaseINSIGHT: The busiest segment has 7 distinct cooking actions
This visualization shows how cooking action complexity changes throughout a single video. By mapping the number of distinct cooking actions performed in each segment, we can identify:
The peak complexity moments in the video (occurring at specific times with higher numbers of distinct actions)
How cooking phases relate to action complexity (with notable activity in both prep and active cooking phases)
The rhythm of the recipe - showing multiple spikes of 4-5 actions throughout the video interspersed with less complex segments
Potential points where viewers might need to pause or rewatch to follow along
In the example above, we can see that this video has several periods of moderate complexity with 3-4 actions, with the peak complexity reaching 7 distinct cooking actions during the prep phase. This kind of insight can help content creators design more balanced cooking videos or add additional explanations at high-complexity points.
Besides the visualizations above, you can perform more targeted analyses with simple pandas queries:
Copy
Ask AI
# Find segments with the most ingredients mentionedingredients_by_segment = segments_df.sort_values('ingredients_mentioned', ascending=False)print("\nSegments with Most Ingredients Mentioned:")print(ingredients_by_segment[['filename', 'start_time', 'end_time', 'ingredients_mentioned']].head(3))# Find distribution of cooking phases across all videosphase_distribution = segments_df['cooking_phase'].value_counts(normalize=True) * 100print("\nDistribution of Cooking Phases:")for phase, percentage in phase_distribution.items(): print(f"{phase}: {percentage:.1f}%")
Copy
Ask AI
Segments with Most Ingredients Mentioned: filename start_time end_time \192 Easy JAPANESE CURRY RICE » Made with Golden Curry 40 60174 The Easiest Ramen To Make At Home - Miso Ramen 280 300222 Easy Carnitas | Basics with Babish 280 300 ingredients_mentioned192 9174 7222 7Distribution of Cooking Phases:prep: 28.0%active_cooking: 27.6%explanation: 18.2%tasting: 7.0%intro: 5.9%N/A: 5.2%plating: 4.5%outro: 3.1%cleanup: 0.3%
Create a structured extraction schema for cooking videos
Process multiple YouTube videos with Cloudglue’s entity extraction
Analyze the extracted data to uncover insights about ingredients, cooking phases, and action complexity
Visualize the results using matplotlib
The structured data extraction capabilities of Cloudglue make it possible to transform unstructured video content into actionable insights. This approach can be extended to any domain where videos contain valuable information that needs to be structured for analysis.